An automated camera on the AWS records both the glacier surface evolution and riming of the station. The clip below was assembled from images taken over a 5-month interval, at a time of day which best shows surface texture. Not all days were included here, as the surface isn't visible when rime obscures the camera housing window!
The date stamp on each image allows meteorological conditions to be assessed at the time. For example, drifting snow is evident on 24 October, when wind speed was ~9 m/s; or compare albedo on 25 or 27 October (~0.62) with that on 2 November (0.84). Although not immediately apparent in these images, the 2011 dry season on Quelccaya ended on 9 September, when the glacier surface was ~18 cm lower than that in the first image (10 July).
Thursday, February 28, 2013
Wednesday, January 16, 2013
Accumulation update for 2012 - 2013
Accumulation on Quelccaya began in earnest during mid-November this
year, which is relatively late. Two earlier snowfall events - in late
September and early November - were followed by settling and ablation.
Although these events contributed mass, they did not result in a surface
height increase.
With a relatively prolonged 2012 dry season, and possibly melting of these two early snowfall events, the mid-November commencement of accumulation should be easily recognizable in the snowpack during 2013 fieldwork.
For the current accumulation season through yesterday, snow depth on the glacier is now at 1 meter. This is about the average for mid-January. With ENSO-neutral conditions in the tropical Pacific predicted to continue into the dry season at Quelccaya, another meter of accumulation is likely by early April.
Thursday, December 13, 2012
10 years for the US Climate Reference Network
Congratulations to the USCRN program on the first decade of operations!
Some of the equipment on the UMass Quelccaya weather station is compatible with that of the U.S. Climate Reference Network (USCRN), which NOAA's National Climatic Data Center (NCDC) began 10 years ago. We chose to incorporate elements of their system at our site as a result of the extensive testing and characterization they carried out. A nice overview of all USCRN aspects and prospects is contained in the Early Online Release of a paper titled "U.S. Climate Reference Network after One Decade of Operations: Status and Assessment." The paper will appear in a future issue of the Bulletin of the American Meteorological Society, and is freely available now from this link.
To stay updated on further developments of the USCRN, follow NCDC on Twitter: @NOAANCDC
Tuesday, August 14, 2012
Fieldwork photos
Photos from this year's fieldwork are in 3 different galleries:
- At the summit our efforts were focused on the weather station (AWS), and in a snowpit as time permitted. Photos here.
- Working at an elevation of nearly 6,000 meters requires adapting to less oxygen (lower partial pressure), providing time to make other observations. Photos from travel to the ice cap and at the margin are here. For several locations - including outlet glacier Qori Kalis - photos from previous years have been mixed in to illustrate ice recession and thinning.
- Among other observations possible while acclimatizing is documenting the elevation and habitats of various bird species living at this high elevation; the Quelccaya margin (~5,200 m or 17,000 ft) represents the upper end of most species' range. Photos of birds seen in 2012 are here (Additional Vilcanota birds can be seen here and here, or this link for more on Diuca speculifera.)
Wednesday, August 1, 2012
Fieldwork weather

The figure above depicts summit weather at Quelccaya prior to and during our 2012 fieldwork. The short synopsis is that during our time at Moraine Camp and the AWS we experienced clear sky, low humidity, and low wind speeds. Just prior was an interval of high humidity, snowfall, moderately-high wind speeds, and lower temperatures.
Here are some details shown in the graph, and implications (click the graphic to see a larger version). Some measurement are presented only through the 11th due to sensor changes and service. We were at the summit from the 9th through the 15th, and near the ice cap 6-16 July:
- Hourly incoming solar radiation is shown in orange. Clear sky continued from the 9th through until the 15th (not shown).
- Blue squares are average daily relative humidity, which increased during our time in Cusco and then dropped abruptly on the day we first reached the summit.
- Snow accumulation & ablation is depicted as the dashed blue line. This is actually a smoothed recording of changes in surface height, where decreasing distance represents snowfall and increasing distance is a combined record of melting, sublimation, wind scour and settling. The measurements are hourly, yet must be smoothed to remove a spurious diurnal cycle due to the impact of air path temperature on the speed of sound - since acoustic sensors are used. Anyway, processes were less continuous than the smoothed plot indicates, suggesting: a) about 1.5 cm of snowfall during the afternoon of July 4th, b) another ~1.5 cm of snowfall late on the 5th, and c) ~1.5 cm of sublimation on the 9th. Note perfect conditions for sublimation on the 9th, including clear sky and high radiation, decreasing humidity, high wind speeds and lowest temperatures of the interval.
- Average wind speed (red diamonds) parallels the humidity pattern, reaching a maximum on the day gear was carried to the summit and then dropping. For several 24-hour periods, it averaged < 3 m/s, and on our 'hottest' day of work at the station the average wind speed was <2 m/s - or <5 miles/hour. Very calm, especially at nearly 6,000 m elevation in the Andes.
- Two different measurements of temperatures are represented on the graph, both as triangles and both as the maximum hourly values each day. The pink values are measurements in a naturally-ventilated, multiplate radiation shield whereas the cyan symbols depict measurements in a sophisticated, fan-aspirated shield compatible with the US CRN system (Climate Reference Network). Note that radiation shield differences can yield huge differences in measured temperature: on 2 days in this interval the difference is >6°C. If data were available from the multiplate shield on the 13th (sensor was being replaced) a 10+ degree difference would not be surprising. Wind speed and solar radiation critically influence temperature measurement!
Tuesday, July 24, 2012
Un gigapan muy grande
As previous posts have indicated, Quelccaya is a large, relatively-flat ice cap. From the summit area, ice flows down and out toward the margins with much of the flow taking place via outlet glaciers such as Qori Kalis.
We shot several GigaPans at Qori Kalis this month, including the broad panorama below. Additional details about Qori Kalis and the composite panorama can be seen in a new tab by clicking on the image caption (or here for those w/o Flash). Details of the glacier are best seen in the second GigaPan below (or here). Several others will be posted shortly, illustrating details of the lake/moraines as well as areas nearby.
Tuesday, July 17, 2012
2012 Fieldwork Return
Back into Cusco last night after ~10 days at Quelccaya. With help from Vicencio Expeditions (Guide Felix, porters Theodoro and Hector, a cook and 8 horses), we accomplished just about all we hoped to. First up was locating the elusive 1983 survey points, a considerable relief. Then, 5 days and 4 nights were spent on top at the AWS, servicing the station and measuring snow. The weather was rather incredible, with cloudless days of no wind and very low humidity. Although at times we baked in the sun, quick checks suggested the air temperature remained below freezing every day; nights were invariably clear and cold. Ablation seems to have been minimal through the interval, due to the relatively fresh snow cover and dominance of sublimation over melting. More details will follow. Here are a few quickly-selected, unedited images.
1. From our tent just before sunrise on 12 July (Happy Birthday Elise).

2. Carsten prepares our morning coffee, crucial task #1 each day.

3. Here the AWS tower has been raised, and instrument adjustments/service are underway.

4. Changing out one of the temperature/humidity sensors.

5. Snowpit, part I. Eventually we went to 4.5 meters, about half again this depth. This required saws and hard effort which broke both of our steel shovels; credit for perseverance goes primarily to Theodoro and Hector (and our trusty Voilé shovel). The contact between the most recent accumulation (i.e., 2011-2012) and the 2011 dry-season surface is readily apparent.

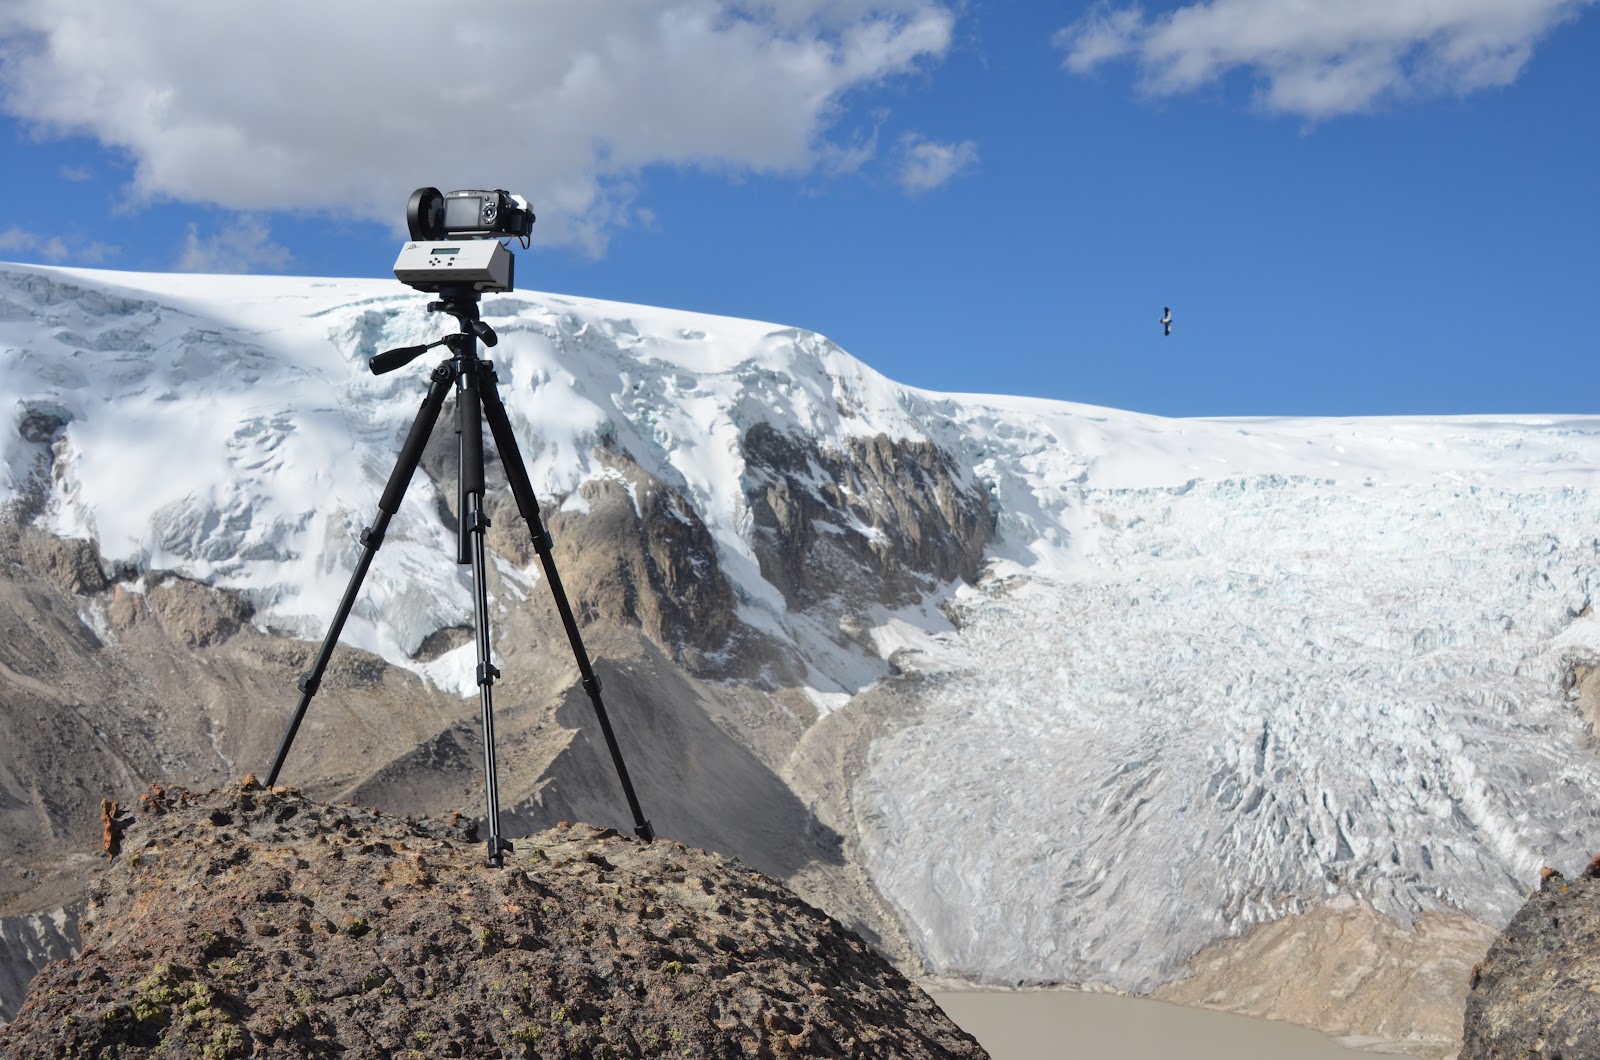
6. Qori Kalis outlet glacier, as seen while waiting for a GigaPan panorama to execute (615 images). Note the adult Mountain Caracara flying by!

1. From our tent just before sunrise on 12 July (Happy Birthday Elise).

2. Carsten prepares our morning coffee, crucial task #1 each day.

3. Here the AWS tower has been raised, and instrument adjustments/service are underway.

4. Changing out one of the temperature/humidity sensors.

5. Snowpit, part I. Eventually we went to 4.5 meters, about half again this depth. This required saws and hard effort which broke both of our steel shovels; credit for perseverance goes primarily to Theodoro and Hector (and our trusty Voilé shovel). The contact between the most recent accumulation (i.e., 2011-2012) and the 2011 dry-season surface is readily apparent.

6. Qori Kalis outlet glacier, as seen while waiting for a GigaPan panorama to execute (615 images). Note the adult Mountain Caracara flying by!
Subscribe to:
Posts (Atom)