Monday, November 23, 2015

El Niños at Quelccaya [updated]


Snowcover last week on Quelccaya was looking rather typical for 17 November (above). However, 2016 is likely to be an unusual year for the glacier, and an important one for our understanding of how El Niño impacts the ice cap's ice core record. The following is a brief overview of how Quelccaya was impacted by two prior strong El Niño events, as well as early evidence for how this current event is already impacting mass balance on the glacier.

Sea surface temperatures (SSTs) in the tropical Pacific Ocean are much higher than normal. The persistence of these anomalies and coupling of ocean-atmosphere processes indicates that an El Niño episode is well underway. A wide range of dynamical prediction models have been quite accurate in forecasting this event (see below, from IRI), and suggest that it is likely to strengthen to a peak during the 2015-16 Northern Hemisphere winter. Amazingly, SST departures last week (to 14 Nov. 2015) reached a record +3.0° in regions Niño 3.4 and Niño 3, almost insuring that this event will be one of the strongest on record (since 1950). [UPDATE:  for the week ending 21 Nov., SST departures in the key Niño 3.4 region hit +3.1° C]

 Documenting the impact of a strong El Niño on Quelccaya Ice Cap in one of the primary objectives of our measurement program, underway since 2003. Comprehensive, high-accuracy meteorological observations at the AWS provide a statistical perspective on Quelccaya's climate at the summit, with which this year's El Niño conditions will be compared. Likewise, our near-annual snow accumulation measurements and detailed sampling for stable isotopes will further help to characterize the El Niño signal.

During the 1982-83 El Niño (see figure below), SST anomalies in Niño 3.4 region peaked at +2.1° from November through January, rising from +1.5 for September (i.e., ASO mean) and +1.9 for October (SON). In the dry season following the 1982-83 event, Thompson et al. (1984) report that a snowpit showed a ~30% reduction in precipitation, relative to the average for the previous 8 years. It was during this following dry season that Thompson's team spent ~3 months on the glacier, as "day after day of clear sky" provided solar power for their ice-core drill (Bowen, 2005). For the still-developing 2015 event, three-month anomalies have been consistently higher than those of 1982, yet the ASO average remained lower than during the 1997-98 event. Given the magnitude of recent warming, we may see a 2015 SON average closer to the 1997-98 anomaly.

Not known directly from 1983 is the extent of ablation at Quelccaya after the expedition departed in August, prior to the next wet season (cf. 1998 image, below). However, satellite imagery from 7 August and 10 October both show fresh snowcover, which would have inhibited ablation by reflecting a higher proportion of incoming radiation. The summit was visited again the next dry season, when a snowpit was dug through 1983-84 accumulation; whether the pit continued down to re-measure 1982-83 accumulation is unknown.


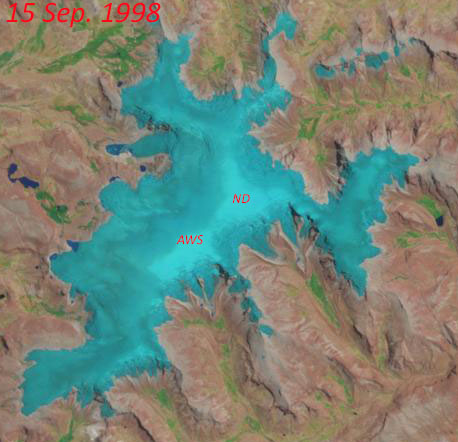
The next strong El Niño, in 1997-98, was the largest event in modern times, persisting longer and with higher anomalies than in 1982-83 (see above). Direct observations at Quelccaya are again not known, yet limited cloud cover in 1998 allowed the Thematic Mapper on Landsat 5 to provide coverage at a regular interval; an animated sequence from 18 Jan. to 2 Nov. 1998 is shown in the right-hand sidebar. Perhaps most dramatic is the 15 September scene, when 97-98 accumulation was restricted to a small area at the summit (see image below, with AWS and "North Dome" drilling site labeled). The next available image from 1998 - two weeks later - shows a thin cover of new snow, which quickly changed the surface radiation balance and effectively ended the dry season. Depending upon when this snowfall occurred within this two-week window, there was either a very thin increment of accumulation added in 1997-98 or - if ablation continued two more weeks - possibly none at all. Could this happen again in 2016?


The large-scale dynamics and timing of each El Niño vary, as does the spatial pattern of impacts. Nonetheless, we expect to see generally warmer and drier than average conditions at Quelccaya (e.g., Rabatel et al., 2013), which initial telemetry data appear to be verifying this year. At the moment our available information is restricted to accumulation and ablation, but temperature and humidity data will be back in the datastream shortly. AWS measurements show snow accumulation at the summit beginning towards the end of October, a couple weeks later than average. The latest image, acquired by Landsat 8 last Tuesday (top image), shows fresh snow on the ice cap at all but the lowest elevations (outlet glaciers). An earlier image from 30 September indicates that the transient snowline had risen considerably since our June fieldwork, when we serviced the AWS, measured accumulation, and sampled snow. SST anomalies by June were already at +1.0°, the fourth consecutive month over the +0.5° El Niño threshold. Imagery without extensive cloud cover is not available between the 30 Sep. and 17 Nov. images, but we have very intriguing AWS telemetry data!

The colorful graph below below depicts seasonal snow surface height change at Quelccaya summit. Individual hydrologic years are in different colors, with each referenced to the year's minimum height (see Fig. 3 of Hurley et al., 2015 for details). The change in surface height since June is shown as the red dotted line - with 40 percent more ablation than any other year since 2002. This ablation was most likely the result of melting, associated with above-normal air temperature, because at least two snowfall events occurred which only briefly reduced the rate of ablation. A full explanation awaits recovery of additional data.

We will continue tracking precipitation at Quelccaya during the 2015-16 wet season, and anticipate obtaining our full set of climate data and time-lapse imagery early in 2016. As the El Niño event concludes, we will visit the summit to further investigate the magnitude of accumulation, and it's impact on isotopic composition.


Thanks to Michael Rawlins and Frank Keimig (UMass Climate System Research Center) for help processing telemetry data.

[UPDATE 12/5:  The Oceanic Niño Index plot above has been updated to include the SON anomaly as well as that for just the month of November. For Niño region 3.4, this deviation of 2.35° C is the largest recorded since records began in 1950. Stay tuned!]

References
Bowen, M. (2005), Thin Ice:  Unlocking the secrets of climate in the world's highest mountains. New York:  Henry Holt & Co., ISBN 9780805064438 (also available in paperback).

Hurley, J. V., M. Vuille, D. R. Hardy, S. J. Burns, and L. G. Thompson (2015), Cold air incursions, δ18O variability, and monsoon dynamics associated with snow days at Quelccaya Ice Cap, Peru, J. Geophys. Res. Atmos., 120, doi:10.1002/2015JD023323.

Rabatel, A. and 27 others (2013), Current state of glaciers in the tropical Andes: a multi-century
perspective on glacier evolution and climate change, The Cryosphere, 7, 81-102, doi:10.5194/tc-7-81-2013

Thompson, L. G., E. Mosley-Thompson, and B. M. Arnao (1984), El-Niño Southern Oscillation Events Recorded in the Stratigraphy of the Tropical Quelccaya Ice Cap, Peru, Science, 226, 50–53.
 

Friday, June 26, 2015

Fieldwork - June 2015


Back to Quelccaya! Earlier this month we spent a couple weeks on and around the ice cap, continuing climate system research. We began the expedition as a large group with a diversity of backgrounds and interests; lots of interesting discussions ensued, while hiking and during meals. Here are some images from the adventure.


Austral winter in the Cordillera Vilcanota is typically cold and dry, with stable weather ideal for conducting fieldwork on Quelccaya. This is not how June began this year, however, as late-season snowfall during April and May continued (see 4 May entry). Here we are looking north over fresh snowcover toward Qori Kalis outlet glacier (not visible). Strong convection is already underway by 10 AM, which brought snow squalls during the afternoon. At the summit a week later we attributed ~90 cm of snow to late accumulation.


Most of the group arrived at Moraine Camp during a heavy precipitation event on the afternoon of 2 June. For more than 2 hours, large grains of graupel pelted us, driven by wind and accompanied by lightning and thunder. One lightning strike was particularly impressive (and frightening), striking a path below camp. Later we learned from our arrieros (see below) that lightning has been unusually prevalent this year, killing numerous alpaca and at least one person.


More than 40 years after his first expedition to Quelccaya Ice Cap, Lonnie Thompson was delighted to be back in 2015. Once again, he carried out a full schedule of photographing the margin, searching for old in-situ plant material emerging from beneath retreating ice, visiting Qori Kalis, and collecting snow and firn at the summit to extend his ice core record. The approach to Quelccaya is now considerably shorter than it was in 1974, yet Lonnie confirms that the partial pressure of oxygen at 5,700 m hasn't gotten any higher!


Collaborating with David Chadwell (UCSD & Scripps) we continue to quantify the magnitude of thinning at Quelccaya since 1983, when Dave worked with Henry Brecher to carefully survey the glacier. Above, Carsten Braun is making a geodetic-quality GPS measurement at one of our reference stations, prior to re-visiting numerous sites on the glacier where elevation is accurately known from the 1983-84 measurements. A manuscript detailing this work will be submitted shortly.


The majority of our time at Quelccaya was occupied by raising the AWS tower, to accommodate the summit's positive mass balance. Working together with Carsten as well as Koky Castañeda through most of 6 days we performed a complete annual service and raised everything by over 3 m. In this upward-looking view (note wind sensor), only a final trimming of guy cables and bundling of sensor leads remains to be done.


The AWS is ready for another year of measurements. One of this year's most-difficult tasks was adjusting the tower orientation to account for glacier flow. Notice how the lowest section of the tower appears tilted? It is indeed, because the tower extends another 25 m beneath the surface! Although the station is located more-or-less at the ice cap summit, where the flow vector is essentially vertical, enough differential horizontal motion has occurred since 2003 that keeping the tower plumb is not a trivial task.


Felix, Koky, and Theodoro in the snowpit, approaching 3 m depth. Here, density measurements and snow samples have been collected in the upper portion, from the shaded south-facing wall (for stable isotopes, black carbon). Just coming into view behind Theo in the deepest section is the 2014 dry-season surface. This marks the beginning of 2014-15 accumulation, and this year the 'surface' was more of a 'zone' than normal, because there was not a prolonged interval without snowfall.


Late afternoons were often spent at the glacier margin not far from camp, observing bird behavior and searching for nests used during the prior breeding season. Note the faintly-visible nest within the cavity below Koky (used by Diuca speculifera; more here). At the time this nest was occupied it was likely even more recessed from the vertical ice face, so protected from weather and relatively safe from both terrestrial predators (e.g. foxes) and from those above (e.g., Mountain Caracara, Phalcoboenus megalopterus or Aplomado Falcon, Falco femoralis).


The vicuña population near Quelccaya has increased tremendously in the past decade (Vicugna vicugna). Groups are frequently seen and heard in the area, right up to the glacier margin.

Wednesday, June 17, 2015

Carsten & Koky: the best!


Fieldwork for June 2015 is now complete, and prior to posting details of our largely-successful trip, I want to first acknowledge these two guys. Through two weeks of not-always-ideal weather at Quelccaya, including six trips to the summit and 6+ meters of digging, no one could ask for more competent and enjoyable assistants/companions. Carsten loves to point out that there are very good reasons why so few automated weather stations (AWS) exist in glacier accumulation zones. This is true, and the Quelccaya AWS would almost certainly not continue functioning so well - and for so long - without the involvement of these two!

The following points provide a glimpse of the critical role played by Carsten & Koky at Quelccaya, this year and in previous field seasons.

The work.  Repeatedly ascending to 5,700 meters is the fun part of our fieldwork. While at the summit - through the full spectrum of Andean winter weather - our work is strenuous and stressful. Among the tasks required in raising the entire AWS tower and electronics by 3 meters are lifting four different enclosures with >100 Ahrs of batteries, swaging dozens of cables together for structural integrity (see red tool Koky is holding), climbing and balancing on the 5 meter-tall tower while using various tools in one hand, and thinking clearly enough at 500 hPa to solve a diversity of mind-bending problems that invariably develop. In the snowpits, collecting and recording details of nearly 100 samples is laborious, while measuring density can be downright exhausting (see Snowmetrics tool Carsten is holding); for the first time, one sample this year exceeded 600 kg/m^3. Yet in all aspects of the work, these guys remain dedicated to completing every task precisely!

Being in the field.  Keeping glacier fieldwork both safe and fun is not always trivial. However, Carsten and Koky's depth of experience - and their fitness - minimize the impact of problems and discomforts which arise. Both recognize that occasional frustrations are to be expected; once challenges are overcome, they move on.  And although all of us would be perfectly happy working up there without Bob Marley, Koky's incredible music archive makes the effort a tiny bit more fun.

The science.  Science, after all, is the raison d'être for being at Quelccaya - and this is always at the forefront of our thoughts. Despite jokes about how much easier our lives would be if we had concentrated on modeling climate rather than measuring it, we are all addicted to the process of doing science in the field - reveling in the the excitement which sometimes results, and accepting the inevitable difficult and tedious moments. In reality, many aspects of the science are done either prior to fieldwork (e.g., designing and planning measurements/sampling), or upon return when data processing and sample analyses are done. During intervals of breathlessly digging snow, or gradually freezing while making motionless observations of bird behavior while they prepare to roost inside the glacier, Carsten and Koky always persist cheerfully. With fieldwork, one never knows when an unexpected situation or observation might prove valuable, whether in interpreting a landscape feature or providing insight into the various processes by which snow accumulation is transformed into a climate record. Our science benefits by having six eyes and three brains on the job!

So, Carsten and Koky once again earn a gigantic "thank you" for their efforts this year. We also thank those behind the scenes, including our entire logistics team led by Benjamin Vicencio, the creative wizardry of modelers with whom we work (M. Vuille and J. Hurley), and others who have helped to keep this project going over the years (R. Bradley, L. Thompson). Finally, we are grateful for both financial and technical support from NOAA ATDD/GCOS as well as NSF.

Saturday, May 30, 2015

Ready for fieldwork!


Acclimatization has gone well, and our next round of fieldwork is about to commence. Excitement is high among our group of scientists, journalists, guides and drivers pictured above, representing 7 countries of origin. Our destination today was Cerro Wanakauri (see track here). At Quelccaya, group members this year will be pursuing a variety of objectives, from anthropology to snow chemistry to artistic photography.

Monday, May 4, 2015

April snow [updated]


After modest snow accumulation during February and March, April 2015 snowfall at Quelccaya was more typical of the core wet season months. For our 11-year period of record, the median height change during April is 12 cm. However, this year's April snowfall was 460 percent of the median, at 55 cm. This is nearly three times that of the next "snowiest" April (2007) and in 2 of the 11 years there was net ablation during April.

Change in surface height only equate with accumulation in water equivalent if densities are equal, yet our experience indicates that snow density is quite consistent at Quelccaya. Next month we will be on the ice cap to measure density profiles, among other tasks, and will have a more accurate measure of accumulation.

The Landsat image above (23 April) illustrates widespread snowcover on the landscape around Quelccaya above ~4,700 m. Our fieldwork beginning later this month will focus on the area within the red ellipse shown on the image, primarily above 5,200 m. Credit:  USGS EROS data center

[UPDATE 5/20:  Accumulation continues! As of 18 May, a mid-month snowy interval was underway, bringing total accumulation for 2014-15 to exactly the median for the date, at 2.05 meters. One-third of the wet-season snowfall has occurred since the end of March, which is unusually late to have so much snow. We will be on the glacier at the end of the month, and will provide an update towards the end of June.]

Tuesday, January 20, 2015

Margin retreat


Looking through images of "North Lake" recently, this one caught my eye. It was taken on 7 July 2013 while climbing up to the ice cap margin. The view is towards the NW, with ice from the north side of Qori Kalis valley visible in the upper right-hand corner. Note that much of the lake surface is frozen, which is typical during the dry season when air temperature is lower and clear sky at night allows radiational cooling. In the portion of the lake barely visible to the right, blocks of ice were strong enough (for Carsten) to walk out onto.

Prior to ~1985 this lake did not exist, having been buried beneath ice cover for 4,700 years (Thompson et al., 2013). As the margin retreated, meltwater was impounded by bedrock which is out of view to the left, and lake formation almost certainly hastened ice retreat. Now note the section of ice within the blue ellipse above, and try to find it here:


This image is a different perspective, a wider field of view (81°) from the peninsula of bedrock just beneath the blue ellipse. It was taken only 15 months later, on 13 October 2014, and a large volume of ice is gone entirely! Here is part of this section in 2012, with a person for scale. This lower image can be explored in greater detail here, and the GigaPan below provides yet another perspective on the lake, also from October 2014.

Retreat of the glacier will likely continue this year, and soon, the margin will no longer be in contact with the lake. Within the past few decades, a series of proglacial lakes have similarly formed in the area due to ice retreat, including the well-documented Qori Kalis, and several others. Efforts continue to understand the rate of ice-volume change underway, as well as the implications for natural and human systems.