Showing posts with label accumulation. Show all posts

Tuesday, January 19, 2021

Recession continues


These two Sentinel-2 images show changes over 4.5 years at a portion of Quelccaya's western margin. The view includes Lonnie Thompson's Base Camp (lower left) for fieldwork since the 1970s, and the marginal lake we refer to as Morojanicocha.

Some visible differences are seasonal, such as the higher water levels in May and lower-albedo ice in the ablation zone during November (also with less snowcover).

Most notable is ongoing retreat of the ice margin, particularly towards the bottom of the image where the ice is thinner. Ice is no longer calving into the lake, and our colleague Gustavo Valdivia reports that it is now possible to walk entirely around it on rock.


Wednesday, October 3, 2018

Seasonal change

The second half of September at Quelccaya is typically characterized by increasing snowfall, as the dry season concludes. Cloudiness increases rapidly at this time of year, as evidenced and measured by sharply increasing longwave radiation receipt. Air temperature continues a steady increase into November.

These aspects of Quelccaya climate are illustrated by the 2 images below, acquired by Senitinel-2 only 5 days apart. On 27 September (upper image), fresh snow is evident at higher elevations of the Vilcanota, particularly on glaciers and eastern portions of this scene. By 2 October (through high thin clouds), fresh snow had ablated from the landscape (middle image). Lower elevations of Quelccaya Ice Cap also become snow-free, revealing the transient snowline (also see lower image).

Further evidence of this seasonal change in climate is provided by the lower image - an enlargement of yesterday's image - showing the apparent disappearance of ice cover from a marginal lake (circled). In July this ice was thick enough to support a person walking across the lake.


Thursday, August 9, 2018

More snow this week


As forecast by SENAMHI, the Vilcanota has received more snow. The Sentinel-2 image from yesterday shows snowcover surrounding Sibinacocha, as well as the area around the hamlet of Phinaya.

Saturday, August 4, 2018

August begins snowy


Sentinel-2 acquired an image of the Cordillera Vilcanota yesterday, 11 days since their previously-published image (via EO Browser)... and fresh snowcover is still widespread.

Compare these two identical scenes, from 3 August (upper) and the last time snowcover was restricted to the highest elevations, on 30 May (lower) - two months ago!

The community of Phinaya, where many alpaca and llama herders are based, is located within the red circle. During June and July, snowcover appears to have been only occasional at this elevation. The smaller red hexagon is the Quelccaya weather station location (5,680 m), illustrating that the transient snowline has remained below the glacier margin (approx. 5,300 m) since May.

Fieldwork begins in a week!

Wednesday, July 25, 2018

¡Tanta nieve! So much snow! [updated x2]


The snowy dry season of 2018 continues in the Cordillera Vilcanota. Yesterday's Sentinel-2 image (above) reveals a landscape blanketed by snow above 4500-4700 m. Quelccaya Ice Cap (lower right) is difficult to delineate, suggesting substantial accumulation at the margin. Hopefully our instrumentation continues to record hourly snowfall at the summit.

Note the variation in color of lakes just west of the glacier, surrounding the area of our camp (labeled). This reflects varying suspended sediment input, with relatively high concentrations apparently flowing into the Qori Kalis proglacial lake (north of camp); snow is accumulating, while also melting and delivering sediment to the lakes. The 'double' lake to the northwest of camp (and Sibinacocha) appear dark blue, as upstream wetlands (bofedales) filter sediment from freshly-exposed areas proximal to the glaciers.

We will be in the area during the second half of August, measuring snow and recovering weather station data. Fieldwork will occur later than normal, allowing an assessment of what appears to be an anomalous year. Although this snow will be beneficial to glacier mass balance, the toll on camelids (llama, alpaca) could be severe - without warming solar radiation typical of the dry season.


[UPDATE 7/26: A press release from SENAMHI* earlier this week (23 July) describes snowfall in the preceding 72 hours above 3,800 m in the Andes, accumulating to 20 cm. In conjunction with clouds, they warn of low temperatures and prolonged snowcover reducing food for livestock.

Gustavo Valdivia wrote yesterday learning details of the situation in the Cordillera Vilcanota. He received a call from the Phinaya community president, who described the situation as critical, because a lot of alpacas died in recent days. The local people agree that the weather is very unusual.

Press releases from SENAMHI can be found here (in Spanish), with a machine translation  here


*SENAMHI is The National Meteorology and Hydrology Service of Peru or El Servicio Nacional de Meteorología e Hidrología del Perú]

[UPDATE 7/27:  Today I learned from Bronwen Konecky (Washington University) that SENAMHI is making daily meteorological summaries available on their website. The closest station to Quelccaya - and one of their highest - is Sibinacocha, at ~4890 m (labeled on map above). These data show 11 mm of water equivalent precipitation on 21 July, followed by 5.9 on the 22nd. Since this automated station is located at the southern end of the lake, the image above suggests that considerably more snow fell at higher elevations. The regional nature of this event is demonstrated by daily totals from Sicuani (~3600 m, 45 km to the SW); very similar daily totals were recorded.

To access any SENAMHI data in Peru, go here, then use the "Seleccionar" button to select a District; zoom in on the map. Thanks, SENAMHI.]

Friday, July 6, 2018

Still Snowy - Quelccaya and beyond


The Cordillera Vilcanota remains snowy, as illustrated by the Sentinel-2 image above from 4 July. Snowcover at high elevations, on south-facing slopes, and on glaciers has changed very little over the past month. At Quelccaya Ice Cap, bare ice is exposed only at the lowest elevations of outlet glaciers (e.g., Qori Kalis, on west side).

Extensive snowcover on the glacier is keeping the albedo high, minimizing mass loss... at least for the moment.

Quelccaya is not alone in being unseasonally snowy this year. For example, in the Karakoram Mountains (Pakistan) climbing teams on mountains such as K2 are finding dangerous avalanche conditions due to heavy snowfall, during the core climbing season. More details can be found here.

Kilimanjaro is also unusually snowy for July, the result of above-average accumulation during the March-May wet season.

In Northeast Greenland, the winter of 2018 brought twice as much snow as the long-term average, and snowcover into early July remains so extensive that Sanderlings and other shorebirds may not even attempt nesting this year. The late snow is having large consequences for the ecosystem.

Finally, snow on portions of the Greenland Ice Sheet is resulting in the "least surface ice loss in decades". As Jason Box notes via Twitter (@climate_ice), these persistent extremes in patterns of atmospheric circulation are an expected signature of climate change.

Friday, June 15, 2018

June snow


Several snowfall events during the first half of June have kept the landscape snowy at Quelccaya this year. In the 14 June image above (ESA Sentinel-2, bands 4,3,2) lingering snow is visible below 4,900 m in shaded locations.

Typically the dry season is underway by mid-June, often with snow only on the glacier. This year, the relatively-bright fresh snow is keeping the albedo low, reducing energy input and ablation of the glacier surface.

Despite the current situation, evidence indicates that recession of the ice margin is accelerating. Planning is underway for fieldwork in the next few months, when snowcover on the glacier will be measured and AWS data since July 2017 will be recovered. We're anxious to document 2017-18 La Niña accumulation!

Tuesday, May 15, 2018

Snowcover update & ice retreat


Quelccaya Ice Cap currently remains largely blanketed by snowcover, excepting the very lowest ablation zone (e.g., Qori Kalis outlet glacier). The GIF above contains only 2 images; the snowy scene without red annotation was acquired last week (10 May 2018). Contrast 2018 snowcover on the glacier with that 2 years earlier, at the end of March 2016.

These images show a portion of the ice cap's western margin. We have visited this area at least annually since 2003, witnessing continuous retreat of the margin and changes in all of these proglacial lakes.

The red ellipses on the 2016 image highlight two areas where margin retreat is clearly evident. Our GPS measurements up through 2017 at the lower section indicate a retreat rate of 10-15 m/year. At the small red circle by the larger lake, the area of bedrock near the circle has expanded, and only a small portion of the glacier still extends into the lake (contrast 2013). Throughout our years of fieldwork in the area we have observed ice calving into this lake, which began forming in ~1985 (Thompson et al., 2013). Within the next year or two the glacier will no longer reach the lake.

One consequence of Quelccaya margin retreat and thinning is loss of suitable nest sites for the "Andean Glacier Bird" (White-winged Diuca-Finch, Idiopsar speculifer; formerly Diuca speculifera). Until the mid-2000s the area near the lower ellipse supported a relatively high density of nests, built directly on the ice (Hardy and Hardy, 2008 and here). As ice at this margin thinned and became less steep, the area was abandoned for nesting. More recently, the area near the small circle has been used for nesting (e.g., 2014 oblique photo of margin at the lake), but as the ice becomes thinner the birds will need to move up in elevation to find suitable, steep ice slopes. Furthermore, the Glacier Bird is not the only bird species impacted by ice recession; a new manuscript detailing this is currently in review (and available upon request). 

Ref:  Thompson, L.G., E. Mosley-Thompson, M.E. Davis, V.S. Zagorodnov, I.M. Howat, V.N. Mikhalenko, and P.-N. Lin. 2013. Annually resolved ice core records of tropical climate variability over the past ~1800 years. Science, vol. 340, 945-950. 10.1126/science.1234210

Tuesday, April 3, 2018

Vilcanota wet season


Image above:  A portion of the Cordillera Vilcanota, including Nevado Ausangate (upper left), Sibinacocha (the big lake), and Quelccaya Ice Cap on 31 March 2018 (Sentinel-2 image).

Our ~15 years of measurements reveal clear relationships between ENSO and climate at Quelccaya. A detailed documentation of these is nearly ready for submission, primarily authored by collaborator John Hurley and titled "ENSO variability of Quelccaya Ice Cap d18O”

Our understanding of Quelccaya's response to ENSO will be further refined when we are able to examine accumulation resulting from the ongoing La Niña event (2017-18). Since last September, negative sea surface temperature anomalies have persisted in the east-central equatorial Pacific. These SST anomalies have been slightly more negative than last year, which followed very warm anomalies associated with the 2015-16 El Niño.

Quantifying the timing and properties of this newest accumulation cannot occur until we visit the weather station, since our data telemetry system failed in 2017. However, satellite imagery suggests that snowfall has been considerable this year. The image above provides the first relatively-clear view of the glacier and surrounding terrain in several months. In this ESA Sentinel-2 "natural-color" image (bands 4, 3, and 2), glaciers and higher peaks are entirely snow covered, and a dusting of snow is visible on terrain west and south of Quelccaya.

Greater detail can be seen in the cropped image below, showing only Quelccaya - and revealing that glacier ice is not exposed even at the lowest elevations (~5,200 m).

Finally, the GIF image at the bottom shows the Sentinel-2 EO Agriculture composite product, on approximately 1 April of the past 3 years. Note in particular the vegetation color difference between the El Niño year 2016, and the next two wet seasons during cold phase ENSO events. Also, there appears to be more snow around the glacier margin this year than in April of 2017. Our ENSO paper will document such ENSO variabilty at the summit of Quelccaya, in terms of snowfall seasonality, the vapor initial d18O values, and air temperature.


Tuesday, November 21, 2017

2017 dry season - towards the end

Satellite imagery from earlier this month show that the 2017-2018 accumulation season began sometime within the past month. The image above from 2 October shows a familiar snowline pattern, as ablation continued. We won't know exactly when accumulation began at the summit until our next visit to the AWS, as telemetry was not restored during July fieldwork. Will there be a La Niña signal in accumulation this year?

Monday, June 19, 2017

dry season begins?


Beautiful clear weather at Quelccaya at the end of last week. The transient snowline appears to be rising, as evidenced by the darker areas of bare ice around the ice cap margins. Note that some snow still exists on high ridges around Quelccaya.

Great products coming from the European Space Agency (ESA) these days, and planned for the future. Hopefully NASA Earth observation will begin receiving more support and recognition, after the U.S. 2018 mid-term elections!

Monday, May 15, 2017

2016-17 accumulation [updated]


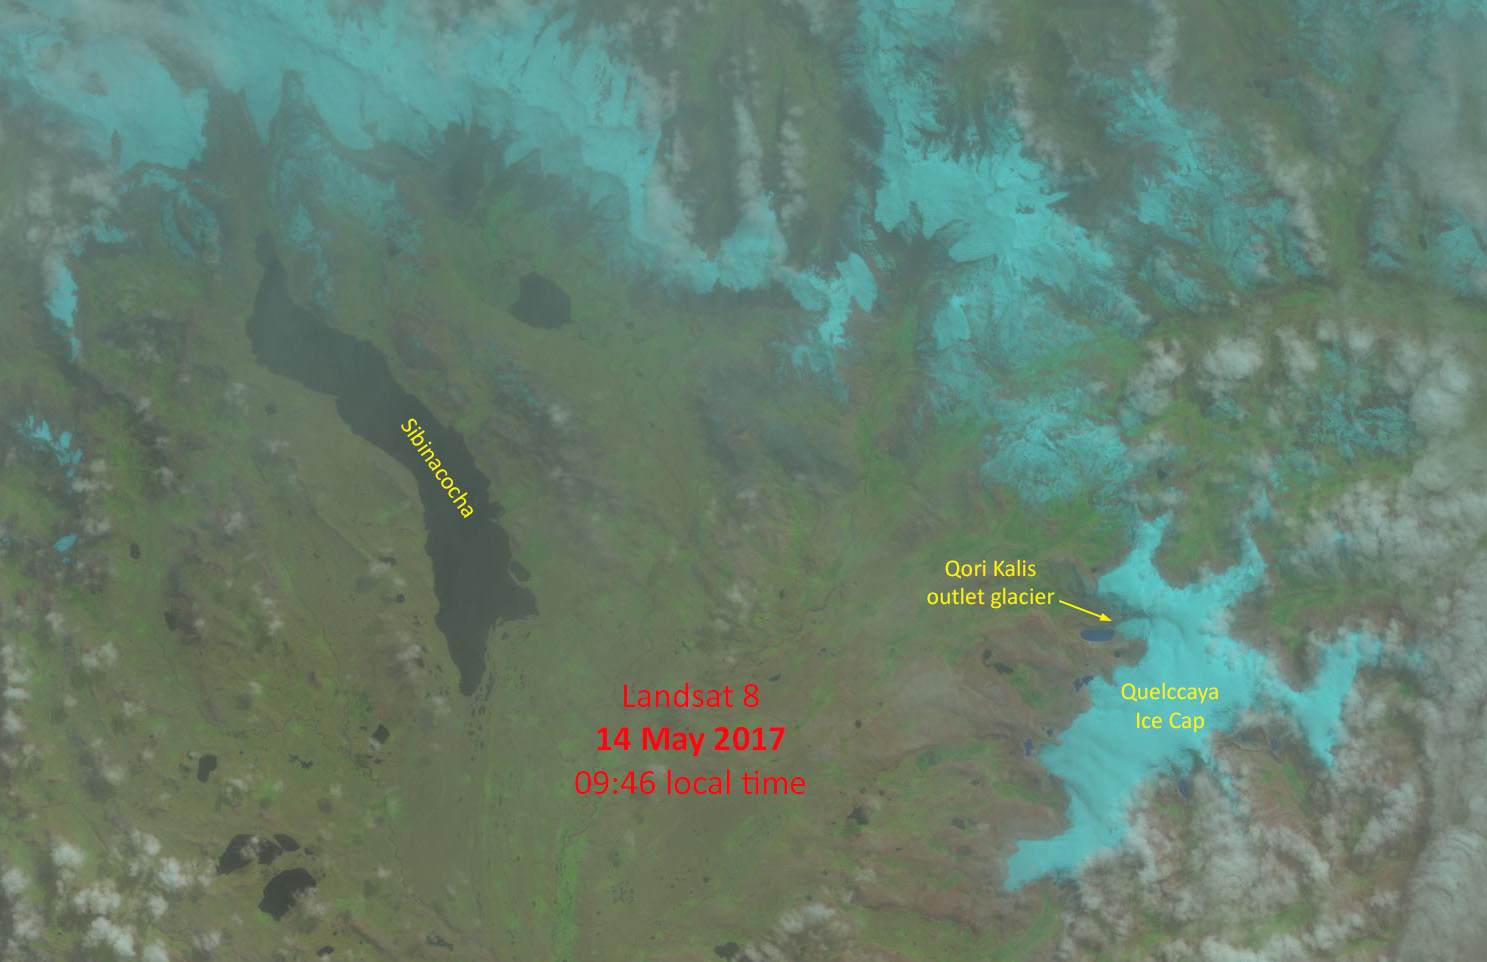
The current accumulation season began ~8 months ago, almost immediately after a Landsat image was acquired on 16 September. Last year was thus an atypical situation in which the ELA can be known with some confidence, which for 2016 was ~5600 m.

Excepting the first half of November, accumulation steadily increased into early April. Although the rate of accumulation then decreased, telemetry reveals that snowfall continues, as illustrated by the image above - depicting the area yesterday through high clouds. Note that fresh snow is visible on the landscape even at elevations below the glaciers. Since the mid-September minimum, 2.05 m of snow has accumulated at the AWS.

[UPDATE 06/01:  Two weeks later, snowcover on Quelccaya and the surrounding landscape shows little change, on a Landsat 8 image acquired on 30 May. Quite a contrast to last year, following reduced accumulation during the 2015-16 El Niño.]

Thursday, November 10, 2016

Accumulation begins for 2016-17


New accumulation is underway at Quelccaya. The image above depicts the ice cap and surrounding terrain on 3 November, thanks to NASA & USGS! Contrast snowcover on the ice cap last week with that shown below on 16 September.

Telemetry of snowfall measurements from the Quelccaya AWS shows that about 6 cm of additional ablation occurred in the week following when the image below was acquired. Between then and 3 November (see above), the AWS recorded 32 cm of snow accumulation - which very likely indicates that the next wet season is underway. So, although net accumulation for the 2015-16 El Niño will be much below average, it appears that the event will indeed be recorded at the summit. This may not have been the case if the wet season began later, as is more typically the case.

Thursday, October 6, 2016

Snowline continues rising


The transient snowline at Quelccaya reached ~5600 m in mid-September, as illustrated on the Landsat 8 image above. Had the wet season begun by then, only the upper ~100 m of the ice cap would have seen net accumulation for the El Niño year 2016. However, it is likely that ablation continued after the time of this image.

A subsequent Landsat image was acquired on 2 October. New snowcover is visible south of Quelccaya, but cloud cover obscures the ice cap. So, we must wait for the next few satellite passes to see whether the snowline continues rising - or if the new wet season has begun. The first opportunity for this assessment will be in ~10 days.

This situation demonstrates a difficulty of mapping minimum snowcover extent from satellites. Thin high clouds (as in this image) or scattered cumulus clouds still allow snowcover assessment, yet cloud cover thick enough to obscure the ground prevents mapping. As a result, the spatial extent of accumulation cannot be accurately determined by remote sensing some years.


Friday, July 22, 2016

Seasonality of accumulation and ablation: not simple!

Earlier posts here have discussed how snow accumulation at Quelccaya during the 2015-16 El Niño was considerably below normal. We verified AWS measurements during April and May fieldwork, measuring for example a mere 30 cm of snow at an elevation only 130 m below the ice cap's summit! On top, we made comprehensive measurements and obtained snow samples for frozen transport and analyses which are currently underway. However, preservation of this meager accumulation will depend upon the extent of both precipitation and ablation currently occurring -- during the 2016 dry season (i.e., approx. June - October).

The following sequence of Landsat 8 images were obtained from the USGS, corresponding to dates shown in pink/purple on the following timeseries of snow surface height at the summit of Quelccaya. Height increases are primarily the result of snowfall, while decreases mostly reflect melting.  In viewing the images below, it might be helpful to have this graph open in another tab or window; click here for a jpeg or here for a PDF.

A composite GIF of the images is shown first. For more detail on each image, scroll down. Captions for each relate snowcover in the scene to AWS measurements in the days and months prior. We will continue tracking accumulation at the summit and relating surface height to Landsat imagery as the season continues. Further information about accumulation in past years, and interpretation of AWS measurements, is detailed in our comprehensive paper in the Journal of Geophysical Research (Hurley et al., 2015). See our previous blog post for images of fieldwork during April and May.


Fig. 1 - Snow-covered glacier and snowy landscape (5 Feb.), after one of the final snowfall events of the 2015-16 "core" wet season. Although impossible to assess the depth of accumulation from this visual image, note high albedo of the entire glacier, raising the reflectivity of incoming shortwave radiation (solar).

Fig. 2 - Two weeks later (21 Feb.), glacier ice is becoming exposed around the margin, and snow has melted from the surrounding landscape. Most of the glacier remains bright (i.e., high albedo) due to a minor snowfall event several days prior (see graph above). The wet season continues through February, and as in figure 1, clouds are indicative of atmospheric instability.

Fig. 3 - During the month between this image (24 Mar.) and that in figure 2, a net lowering of glacier surface height occurred, despite a snowy interval (late Feb.) and a large snowfall event in early March. A larger area of glacier ice is visible around the margin, and albedo has decreased at all but the highest elevations. To the west of the ice cap a solid red circle indicates the location of our camp during April / May fieldwork.

Fig. 4 - Only slight changes in the month since figure 3. On this date (25 Apr.) we were at the glacier, camped at the location indicated in figure 3. Just 5 days prior, a precipitation event with heavy graupel was sufficient to collapse one of our tents. Snowcover blanketed the regional landscape far to the west the next morning; four days later (see above), new snow remains on the glacier but has melted from the landscape. Note location of AWS, which is not indicated on subsequent figures.

Fig. 5 - During our time at Quelccaya we observed a seasonal change in weather which we interpret to be the transition from wet to dry seasons. Between a few days prior to the time of figure 4 and our departure on 4 May, the atmosphere became considerably more stable. Particularly at lower elevations on the ice cap, the melt rate was tremendous, and with a thin cover of snow the transient snowline rapidly increased in elevation. This image from 11 May - only 2 weeks after that in figure 4 - demonstrates how rapidly mass can be lost from a glacier in years of low accumulation.

Fig. 6 - Rapid ablation earlier in the month was halted by a relatively minor amount of accumulation ending just a few days prior to this image (27 May). The receipt of net radiation decreased tremendously due to higher albedo of the fresh snowcover.
Fig. 7 - Two weeks later (12 Jun.) mid-May snow accumulation is ablating. Due to a problem processing telemetry data, snowfall in the days just prior to and following this date is not known.

Fig. 8 - This image of the same scene from 28 Jun. depicts a typical dry-season snowfall event which occurred the day before. This is the southern hemisphere winter, when air temperatures are lower and precipitation arrives in the form of snow at lower elevations than during the wet season. Although partially obscured by clouds, note widespread snowcover on the landscape.

Fig. 9 - Two weeks after Fig. 8, snow lingers on the landscape, yet albedo is decreasing at lower elevations of the glacier as the new snow melts and sublimates. Ultimately, the extent to which 2015-16 accumulation is preserved will depend upon whether additional winter events occur. In general, however, surface lowering at the summit (i.e., ablation) typically - but not always - accelerates during August into September, and sometimes into October. Net accumulation for the mass-balance year cannot be determined until the subsequent wet season begins.

Monday, May 9, 2016

Fieldwork at Quelccaya, April-May 2016

We returned recently from an exciting 19 days of fieldwork at Quelccaya. The expedition was timed to coincide with the conclusion of the wet season following the very strong 2015-16 El Niño, and we gained considerable new information. Specific objectives related to this anomalous year included:  AWS data recovery and annual instrument maintenance; snowpit measurements and sampling for chemical analyses; and both GPS mass balance and ice margin measurements. We also had an opportunity - which for over a decade was only a dream - to spend time learning about and documenting breeding behavior of the White-winged Diuca-Finch. This species is among the highest-elevation nesting birds of the Western Hemisphere, and is the only species known to build nests on glaciers (see here for background, soon to be updated); our recent observations yielded a wealth of new understandings. As always, Vicencio Expeditions provided fantastic logistical support, allowing our team of 5 to work safely and efficiently. Below is a quick collection of images documenting some of our observations.

Fig. 1 (above):  Quelccaya Ice Cap's western margin, at which our group spent 2+ weeks during April and early May. Note that the transient snowline is already at nearly 5500 m, due to low accumulation and warmth during the strong 2015-16 El Niño. Qori Kalis outlet glacier is partially visible towards the left side of the image; our efforts on this trip were concentrated at the outlet glacier just right of center.

Fig. 2:  Alipampa Camp at the end of the road (4765 m), where we spent 2 nights acclimatizing. Snowfall overnight was somewhat unexpected.

Fig. 3:  More snow, three mornings later, at Moraine Camp (~5200 m). Note frozen lake, as well as people and horse for scale.

Fig. 4:  Quelccaya margin just south of the figure 1 panorama. Tiny patches of new snow are visible on the otherwise-dark ablation zone of the lower ice tongue. This low-albedo surface absorbs roughly half of the solar radiation incident upon it on sunny days, becoming a maze of tiny meltwater runoff channels.

Fig. 5:  Qori Kalis outlet glacier, which has thinned dramatically in recent years - yet still extends into the lake.

Fig. 6:  Mountain Guide Benjamin Felix Vicencio gets an overview of Qori Kalis.

Fig. 7:  After several snowy days initially, high pressure built in over Quelccaya, resulting in extensive melting at all elevations on the glacier. Meltwater production led to hours of repeated calving at this ice face, filling part of the lake with ice fragments.

Fig. 8:  Meltwater runoff from the ice margin (above rocks in this view) brought greater discharge to many streams than we had seen previously.

Fig. 9:  Evidence from one of the runoff channels of high discharge during the wet season; these are roots from a plant which had become established near the stream.

Fig. 10:  At the summit AWS, Felix is always eager to help. For the past 12 years, the station's enclosures have been buried upon our dry-season arrival. During the current El Niño event, accumulation was much lower than normal. Indeed, at the end of April - with potentially 6-7 months of ablation ahead before the next wet season - accumulation (w.e.) was less than any other year of the 2003 ice core record since at least the late-19th century*! We will soon provide more details of this extreme situation.

[*Caveats to this statement are required. Current accumulation is based on the amount present on 2 May 2016, above the 2015 dry season surface (water equivalence). This may under-estimate accumulation if a greater-than-normal proportion of precipitation was in the form of rain and percolated completely through the annual increment. Under-estimation could also occur if a greater proportion of meltwater percolated completely through, rather than refreezing within 2015-16 accumulation. However, the accumulation present in early May has always been less than that preserved when the subsequent wet season begins (due, for example, to dry-season sublimation).]

Fig. 11:  The outlet glacier just above our camp, where a major focus of the most-recent expedition was to study the breeding of Diuca speculifera or White-winged Diuca-Finch - the "Glacier Bird of the Andes".

Fig. 12:  Four intensive days were spent searching for active nests, which diucas build directly on glacier ice in well-protected, hidden locations (earlier, initial details here).

Fig. 13:  Locating active nests of any bird species requires patience and astute observation skills. Extra motivation is required to do so in the snow at elevations above 5000 meters.

Fig. 14:  Two key members of the nest-searching team. All bird observations throughout the entire expedition are available in eBird (~50 spp. from >4800 m).

Fig. 15:  An adult Diuca speculifera seeking insects on floating ice fragments (see lake in figs 7 & 11).

Fig. 16:  At the site of one diuca nest, high on a 60-meter cliff face. Ideally - as in this case - the birds choose nest sites which are safe from predation (esp. Fox, Pseudalopex culpaeus and Mountain Caracara, Phalcoboenus megalopterus) and offer thermal protection (esp. heat loss by longwave radiation). The actual nest site here is ~2 m to the right of the person.

Fig. 17:  A juvenile diuca begging for food from a parent.

Fig. 18:  Tremendous biodiversity exists in Cordillera Vilcanota. Here a lizard basks in the sun adjacent to glacier ice (background), an atypical environment for most lizard species.

Fig. 19:  Quelccaya margin just south of the section we concentrated on this time. A decade ago this margin was also a steep cliff, with numerous diuca nests every year. However, over the past 30 years our measurements with Dave Chadwell (Scripps & UCSD) document that the glacier in this area has thinned by more than 60 meters (paper in review). Where will diucas nest in the future, as recession of the ice cap accelerates and suitable locations disappear?

Fig. 20:  Sunrise on Nevado Ausangate, highest peak of the Cordillera Vilcanota (6384 m).