Tuesday, August 29, 2017

"Mountain: Life At The Extreme" (new BBC series)


On Wednesday evenings at 9 pm starting 30 August, television network BBC TWO will be airing a new 3-part documentary series exploring three different mountain ranges: the Rockies, the Himalaya and the Andes.

Each episode is more than a natural history program in that it depicts examples of both the "extraordinary animals and remarkable people" living in these extreme environments (quote credit here).

The Rocky Mountain
sequences feature wolverines, extreme skier Hilaree O'Neill, big horn sheep, and Native American horse racing - among others. Clips and more are available on their website:  <http://www.bbc.co.uk/programmes/b093x4gb>

The Himalaya episode also features
animals, along with the people comprising remarkable ancient cultures. One exciting sequence follows Nepali ultrarunner Mira Rai through a race. (Mira is featured in the May 2017 issue of Outside Magazine, and will be running one of the UTMB races in Chamonix this week.) For more on the episode, including clips and updated information, check the BBC website: <http://www.bbc.co.uk/programmes/b094klt5>

Details on the final episode airing 13 September have not yet being released. This post will be updated when they are - for it includes a sequence on our work at Quelccaya.

Unfortunately for North Americans, BBC TWO is not available. There will be rebroadcasts by PBS, but dates are not yet available.

Tuesday, August 15, 2017

dry-season weather


We visited Quelccaya for fieldwork during July this year and experienced a long interval of sunny, dry weather. Although July is solidly within the core winter dry season, the atmosphere was particularly dry at this time; the cloud visible in the background above was literally the largest we saw during our time at the ice cap.

Below are two oblique views of the glacier margin, on the day that we arrived in the area (20 July) and the day we departed (27 July). Due to funding constraints, this was a relatively short trip. After 8 days of clear sky and intense solar radiation, some might expect to see more change in the transient snowline than the images show. In other years of fieldwork this has certainly been the case. This year, the areas of greatest apparent change over the interval are highlighted by the red ellipses. Although these areas were determined subjectively from the images, rather than measurements of snow depth, two clear-sky satellite images roughly bracketing the period reveal a similar pattern (see below).

Why so little ablation of snow, within a zone which is both thinning and retreating rapidly in recent decades? Most likely, this was due to the combination of dry atmosphere and low wind speed during this interval. With a negative vapor pressure gradient due to the dry air, any available energy went toward sublimation, requiring ~8 times more energy per kilogram than melting. Furthermore, low wind speed suppressed turbulent transfer of latent heat. At the summit, relative humidity was typically ~10 percent (vapor pressure <2 hPa) and rarely rising to 50 percent during the afternoons.

Despite little ablation during this brief interval of the dry season, recession of the ice cap in this area is accelerating. A subsequent post and paper will quantify retreat we have been measuring since 2008, revealing the profound changes associated with the 2015-16 El Niño event.


Monday, June 19, 2017

dry season begins?


Beautiful clear weather at Quelccaya at the end of last week. The transient snowline appears to be rising, as evidenced by the darker areas of bare ice around the ice cap margins. Note that some snow still exists on high ridges around Quelccaya.

Great products coming from the European Space Agency (ESA) these days, and planned for the future. Hopefully NASA Earth observation will begin receiving more support and recognition, after the U.S. 2018 mid-term elections!

Monday, May 15, 2017

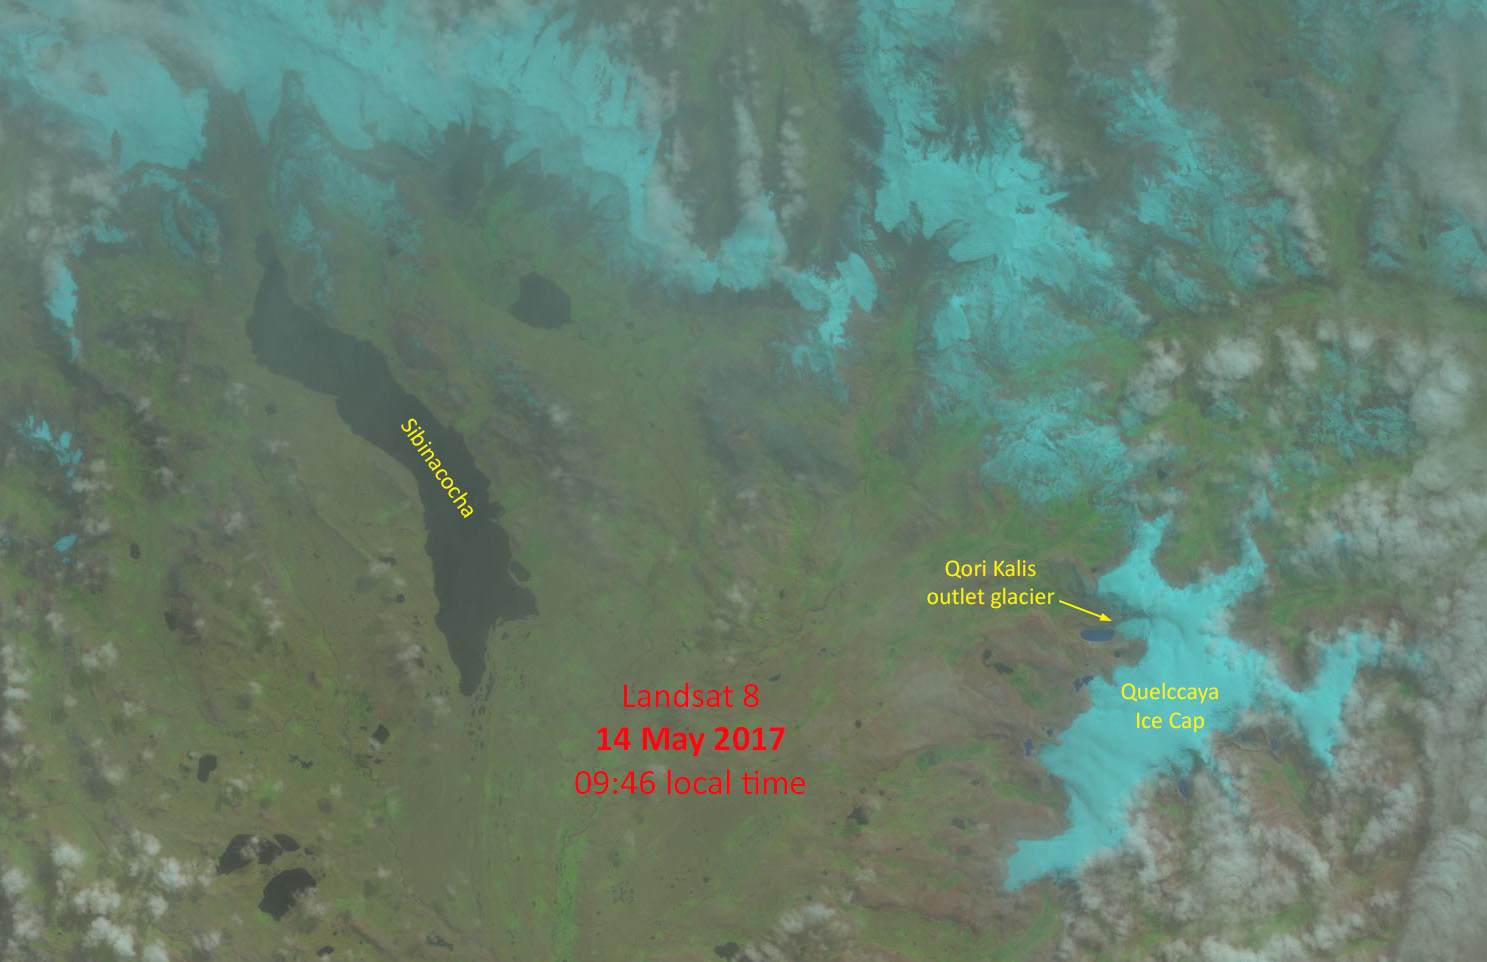
2016-17 accumulation [updated]


The current accumulation season began ~8 months ago, almost immediately after a Landsat image was acquired on 16 September. Last year was thus an atypical situation in which the ELA can be known with some confidence, which for 2016 was ~5600 m.

Excepting the first half of November, accumulation steadily increased into early April. Although the rate of accumulation then decreased, telemetry reveals that snowfall continues, as illustrated by the image above - depicting the area yesterday through high clouds. Note that fresh snow is visible on the landscape even at elevations below the glaciers. Since the mid-September minimum, 2.05 m of snow has accumulated at the AWS.

[UPDATE 06/01:  Two weeks later, snowcover on Quelccaya and the surrounding landscape shows little change, on a Landsat 8 image acquired on 30 May. Quite a contrast to last year, following reduced accumulation during the 2015-16 El Niño.]

Thursday, November 10, 2016

Accumulation begins for 2016-17


New accumulation is underway at Quelccaya. The image above depicts the ice cap and surrounding terrain on 3 November, thanks to NASA & USGS! Contrast snowcover on the ice cap last week with that shown below on 16 September.

Telemetry of snowfall measurements from the Quelccaya AWS shows that about 6 cm of additional ablation occurred in the week following when the image below was acquired. Between then and 3 November (see above), the AWS recorded 32 cm of snow accumulation - which very likely indicates that the next wet season is underway. So, although net accumulation for the 2015-16 El Niño will be much below average, it appears that the event will indeed be recorded at the summit. This may not have been the case if the wet season began later, as is more typically the case.

Thursday, October 6, 2016

Snowline continues rising


The transient snowline at Quelccaya reached ~5600 m in mid-September, as illustrated on the Landsat 8 image above. Had the wet season begun by then, only the upper ~100 m of the ice cap would have seen net accumulation for the El Niño year 2016. However, it is likely that ablation continued after the time of this image.

A subsequent Landsat image was acquired on 2 October. New snowcover is visible south of Quelccaya, but cloud cover obscures the ice cap. So, we must wait for the next few satellite passes to see whether the snowline continues rising - or if the new wet season has begun. The first opportunity for this assessment will be in ~10 days.

This situation demonstrates a difficulty of mapping minimum snowcover extent from satellites. Thin high clouds (as in this image) or scattered cumulus clouds still allow snowcover assessment, yet cloud cover thick enough to obscure the ground prevents mapping. As a result, the spatial extent of accumulation cannot be accurately determined by remote sensing some years.


Friday, July 22, 2016

Seasonality of accumulation and ablation: not simple!

Earlier posts here have discussed how snow accumulation at Quelccaya during the 2015-16 El Niño was considerably below normal. We verified AWS measurements during April and May fieldwork, measuring for example a mere 30 cm of snow at an elevation only 130 m below the ice cap's summit! On top, we made comprehensive measurements and obtained snow samples for frozen transport and analyses which are currently underway. However, preservation of this meager accumulation will depend upon the extent of both precipitation and ablation currently occurring -- during the 2016 dry season (i.e., approx. June - October).

The following sequence of Landsat 8 images were obtained from the USGS, corresponding to dates shown in pink/purple on the following timeseries of snow surface height at the summit of Quelccaya. Height increases are primarily the result of snowfall, while decreases mostly reflect melting.  In viewing the images below, it might be helpful to have this graph open in another tab or window; click here for a jpeg or here for a PDF.

A composite GIF of the images is shown first. For more detail on each image, scroll down. Captions for each relate snowcover in the scene to AWS measurements in the days and months prior. We will continue tracking accumulation at the summit and relating surface height to Landsat imagery as the season continues. Further information about accumulation in past years, and interpretation of AWS measurements, is detailed in our comprehensive paper in the Journal of Geophysical Research (Hurley et al., 2015). See our previous blog post for images of fieldwork during April and May.


Fig. 1 - Snow-covered glacier and snowy landscape (5 Feb.), after one of the final snowfall events of the 2015-16 "core" wet season. Although impossible to assess the depth of accumulation from this visual image, note high albedo of the entire glacier, raising the reflectivity of incoming shortwave radiation (solar).

Fig. 2 - Two weeks later (21 Feb.), glacier ice is becoming exposed around the margin, and snow has melted from the surrounding landscape. Most of the glacier remains bright (i.e., high albedo) due to a minor snowfall event several days prior (see graph above). The wet season continues through February, and as in figure 1, clouds are indicative of atmospheric instability.

Fig. 3 - During the month between this image (24 Mar.) and that in figure 2, a net lowering of glacier surface height occurred, despite a snowy interval (late Feb.) and a large snowfall event in early March. A larger area of glacier ice is visible around the margin, and albedo has decreased at all but the highest elevations. To the west of the ice cap a solid red circle indicates the location of our camp during April / May fieldwork.

Fig. 4 - Only slight changes in the month since figure 3. On this date (25 Apr.) we were at the glacier, camped at the location indicated in figure 3. Just 5 days prior, a precipitation event with heavy graupel was sufficient to collapse one of our tents. Snowcover blanketed the regional landscape far to the west the next morning; four days later (see above), new snow remains on the glacier but has melted from the landscape. Note location of AWS, which is not indicated on subsequent figures.

Fig. 5 - During our time at Quelccaya we observed a seasonal change in weather which we interpret to be the transition from wet to dry seasons. Between a few days prior to the time of figure 4 and our departure on 4 May, the atmosphere became considerably more stable. Particularly at lower elevations on the ice cap, the melt rate was tremendous, and with a thin cover of snow the transient snowline rapidly increased in elevation. This image from 11 May - only 2 weeks after that in figure 4 - demonstrates how rapidly mass can be lost from a glacier in years of low accumulation.

Fig. 6 - Rapid ablation earlier in the month was halted by a relatively minor amount of accumulation ending just a few days prior to this image (27 May). The receipt of net radiation decreased tremendously due to higher albedo of the fresh snowcover.
Fig. 7 - Two weeks later (12 Jun.) mid-May snow accumulation is ablating. Due to a problem processing telemetry data, snowfall in the days just prior to and following this date is not known.

Fig. 8 - This image of the same scene from 28 Jun. depicts a typical dry-season snowfall event which occurred the day before. This is the southern hemisphere winter, when air temperatures are lower and precipitation arrives in the form of snow at lower elevations than during the wet season. Although partially obscured by clouds, note widespread snowcover on the landscape.

Fig. 9 - Two weeks after Fig. 8, snow lingers on the landscape, yet albedo is decreasing at lower elevations of the glacier as the new snow melts and sublimates. Ultimately, the extent to which 2015-16 accumulation is preserved will depend upon whether additional winter events occur. In general, however, surface lowering at the summit (i.e., ablation) typically - but not always - accelerates during August into September, and sometimes into October. Net accumulation for the mass-balance year cannot be determined until the subsequent wet season begins.