Monday, June 19, 2017
dry season begins?
Beautiful clear weather at Quelccaya at the end of last week. The transient snowline appears to be rising, as evidenced by the darker areas of bare ice around the ice cap margins. Note that some snow still exists on high ridges around Quelccaya.
Great products coming from the European Space Agency (ESA) these days, and planned for the future. Hopefully NASA Earth observation will begin receiving more support and recognition, after the U.S. 2018 mid-term elections!
Monday, May 15, 2017
2016-17 accumulation [updated]
The current accumulation season began ~8 months ago, almost immediately after a Landsat image was acquired on 16 September. Last year was thus an atypical situation in which the ELA can be known with some confidence, which for 2016 was ~5600 m.
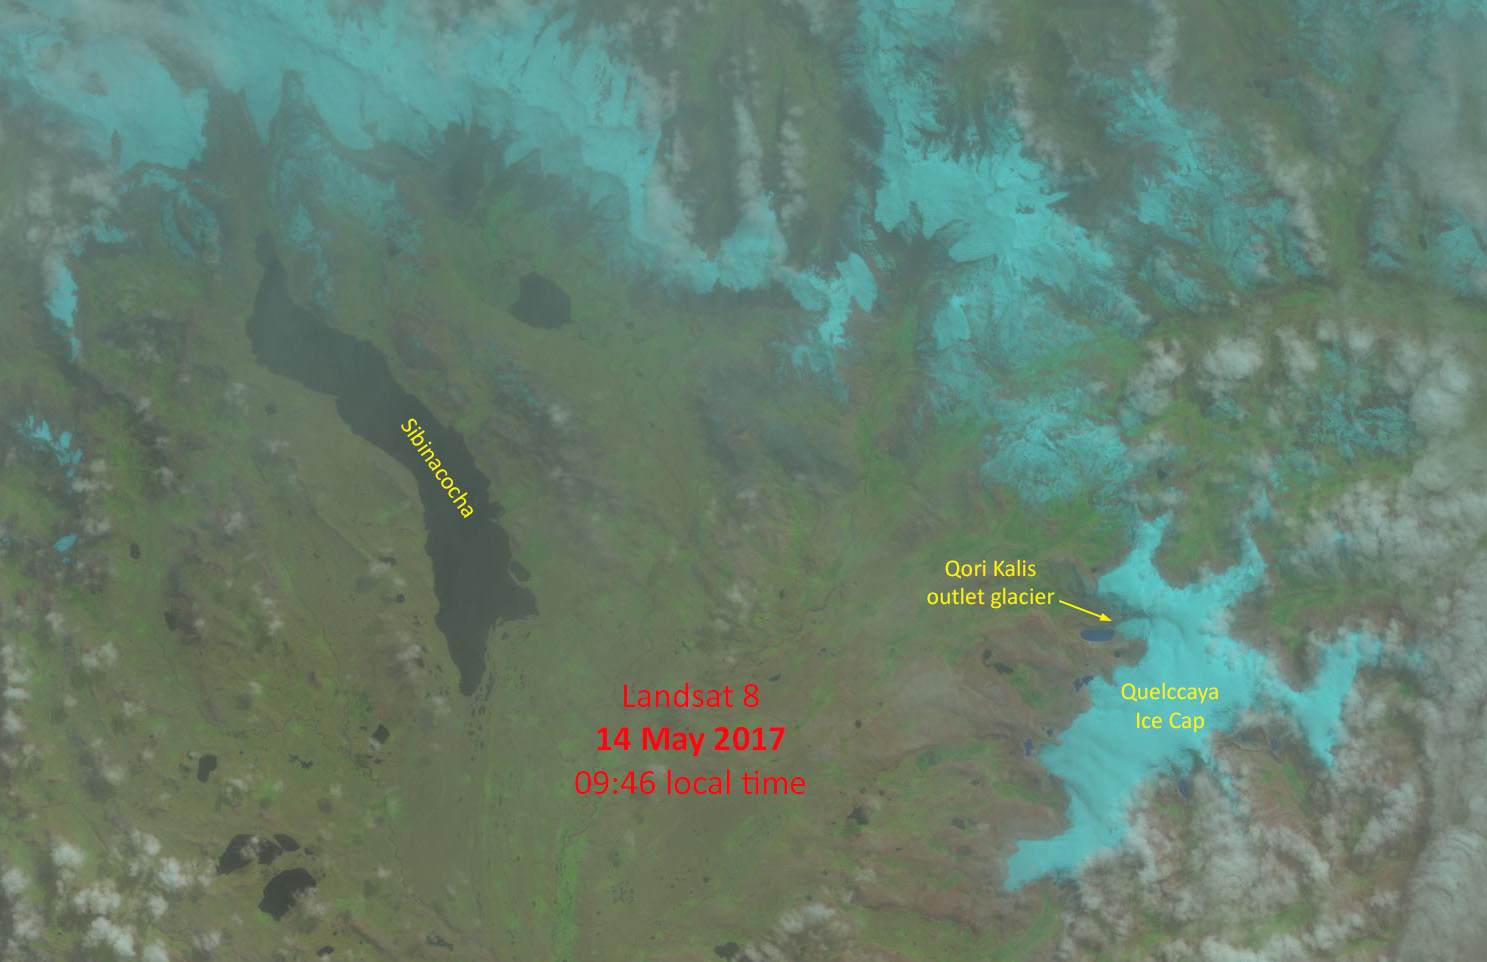
Excepting the first half of November, accumulation steadily increased into early April. Although the rate of accumulation then decreased, telemetry reveals that snowfall continues, as illustrated by the image above - depicting the area yesterday through high clouds. Note that fresh snow is visible on the landscape even at elevations below the glaciers. Since the mid-September minimum, 2.05 m of snow has accumulated at the AWS.
[UPDATE 06/01: Two weeks later, snowcover on Quelccaya and the surrounding landscape shows little change, on a Landsat 8 image acquired on 30 May. Quite a contrast to last year, following reduced accumulation during the 2015-16 El Niño.]
Thursday, November 10, 2016
Accumulation begins for 2016-17
New accumulation is underway at Quelccaya. The image above depicts the ice cap and surrounding terrain on 3 November, thanks to NASA & USGS! Contrast snowcover on the ice cap last week with that shown below on 16 September.
Telemetry of snowfall measurements from the Quelccaya AWS shows that about 6 cm of additional ablation occurred in the week following when the image below was acquired. Between then and 3 November (see above), the AWS recorded 32 cm of snow accumulation - which very likely indicates that the next wet season is underway. So, although net accumulation for the 2015-16 El Niño will be much below average, it appears that the event will indeed be recorded at the summit. This may not have been the case if the wet season began later, as is more typically the case.
Thursday, October 6, 2016
Snowline continues rising
The transient snowline at Quelccaya reached ~5600 m in mid-September, as illustrated on the Landsat 8 image above. Had the wet season begun by then, only the upper ~100 m of the ice cap would have seen net accumulation for the El Niño year 2016. However, it is likely that ablation continued after the time of this image.
A subsequent Landsat image was acquired on 2 October. New snowcover is visible south of Quelccaya, but cloud cover obscures the ice cap. So, we must wait for the next few satellite passes to see whether the snowline continues rising - or if the new wet season has begun. The first opportunity for this assessment will be in ~10 days.
This situation demonstrates a difficulty of mapping minimum snowcover extent from satellites. Thin high clouds (as in this image) or scattered cumulus clouds still allow snowcover assessment, yet cloud cover thick enough to obscure the ground prevents mapping. As a result, the spatial extent of accumulation cannot be accurately determined by remote sensing some years.
Friday, July 22, 2016
Seasonality of accumulation and ablation: not simple!
Earlier posts here have discussed how snow accumulation at Quelccaya during the 2015-16 El Niño was considerably below normal. We verified AWS measurements during April and May fieldwork, measuring for example a mere 30 cm of snow at an elevation only 130 m below the ice cap's summit! On top, we made comprehensive measurements and obtained snow samples for frozen transport and analyses which are currently underway. However, preservation of this meager accumulation will depend upon the extent of both precipitation and ablation currently occurring -- during the 2016 dry season (i.e., approx. June - October).
The following sequence of Landsat 8 images were obtained from the USGS, corresponding to dates shown in pink/purple on the following timeseries of snow surface height at the summit of Quelccaya. Height increases are primarily the result of snowfall, while decreases mostly reflect melting. In viewing the images below, it might be helpful to have this graph open in another tab or window; click here for a jpeg or here for a PDF.
A composite GIF of the images is shown first. For more detail on each image, scroll down. Captions for each relate snowcover in the scene to AWS measurements in the days and months prior. We will continue tracking accumulation at the summit and relating surface height to Landsat imagery as the season continues. Further information about accumulation in past years, and interpretation of AWS measurements, is detailed in our comprehensive paper in the Journal of Geophysical Research (Hurley et al., 2015). See our previous blog post for images of fieldwork during April and May.
The following sequence of Landsat 8 images were obtained from the USGS, corresponding to dates shown in pink/purple on the following timeseries of snow surface height at the summit of Quelccaya. Height increases are primarily the result of snowfall, while decreases mostly reflect melting. In viewing the images below, it might be helpful to have this graph open in another tab or window; click here for a jpeg or here for a PDF.
A composite GIF of the images is shown first. For more detail on each image, scroll down. Captions for each relate snowcover in the scene to AWS measurements in the days and months prior. We will continue tracking accumulation at the summit and relating surface height to Landsat imagery as the season continues. Further information about accumulation in past years, and interpretation of AWS measurements, is detailed in our comprehensive paper in the Journal of Geophysical Research (Hurley et al., 2015). See our previous blog post for images of fieldwork during April and May.

![]() |
| Fig. 7 - Two weeks later (12 Jun.) mid-May snow accumulation is ablating. Due to a problem processing telemetry data, snowfall in the days just prior to and following this date is not known. |
Monday, May 9, 2016
Fieldwork at Quelccaya, April-May 2016
We returned recently from an exciting 19 days of fieldwork at Quelccaya.
The expedition was timed to coincide with the conclusion of the wet
season following the very strong 2015-16 El Niño, and we gained
considerable new information. Specific objectives
related to this anomalous year included: AWS data recovery and annual
instrument maintenance; snowpit measurements and sampling for chemical analyses; and both GPS mass
balance and ice margin measurements. We also had an opportunity - which
for over a decade was only a dream - to spend time learning about and
documenting breeding behavior of the White-winged Diuca-Finch. This
species is among the highest-elevation nesting birds of the Western
Hemisphere, and is the only species known to build nests on glaciers
(see here for background, soon to be updated); our recent observations
yielded a wealth of new understandings. As always, Vicencio Expeditions
provided fantastic logistical support, allowing our team of 5 to work
safely and efficiently. Below is a quick collection of images
documenting some of our observations.
Fig. 1 (above): Quelccaya Ice Cap's western margin, at which our group spent 2+ weeks during April and early May. Note that the transient snowline is already at nearly 5500 m, due to low accumulation and warmth during the strong 2015-16 El Niño. Qori Kalis outlet glacier is partially visible towards the left side of the image; our efforts on this trip were concentrated at the outlet glacier just right of center.
Fig. 2: Alipampa Camp at the end of the road (4765 m), where we spent 2 nights acclimatizing. Snowfall overnight was somewhat unexpected.
Fig. 3: More snow, three mornings later, at Moraine Camp (~5200 m). Note frozen lake, as well as people and horse for scale.
Fig. 4: Quelccaya margin just south of the figure 1 panorama. Tiny patches of new snow are visible on the otherwise-dark ablation zone of the lower ice tongue. This low-albedo surface absorbs roughly half of the solar radiation incident upon it on sunny days, becoming a maze of tiny meltwater runoff channels.
Fig. 5: Qori Kalis outlet glacier, which has thinned dramatically in recent years - yet still extends into the lake.
Fig. 6: Mountain Guide Benjamin Felix Vicencio gets an overview of Qori Kalis.
Fig. 7: After several snowy days initially, high pressure built in over Quelccaya, resulting in extensive melting at all elevations on the glacier. Meltwater production led to hours of repeated calving at this ice face, filling part of the lake with ice fragments.
Fig. 8: Meltwater runoff from the ice margin (above rocks in this view) brought greater discharge to many streams than we had seen previously.
Fig. 9: Evidence from one of the runoff channels of high discharge during the wet season; these are roots from a plant which had become established near the stream.
Fig. 10: At the summit AWS, Felix is always eager to help. For the past 12 years, the station's enclosures have been buried upon our dry-season arrival. During the current El Niño event, accumulation was much lower than normal. Indeed, at the end of April - with potentially 6-7 months of ablation ahead before the next wet season - accumulation (w.e.) was less than any other year of the 2003 ice core record since at least the late-19th century*! We will soon provide more details of this extreme situation.
[*Caveats to this statement are required. Current accumulation is based on the amount present on 2 May 2016, above the 2015 dry season surface (water equivalence). This may under-estimate accumulation if a greater-than-normal proportion of precipitation was in the form of rain and percolated completely through the annual increment. Under-estimation could also occur if a greater proportion of meltwater percolated completely through, rather than refreezing within 2015-16 accumulation. However, the accumulation present in early May has always been less than that preserved when the subsequent wet season begins (due, for example, to dry-season sublimation).]
Fig. 11: The outlet glacier just above our camp, where a major focus of the most-recent expedition was to study the breeding of Diuca speculifera or White-winged Diuca-Finch - the "Glacier Bird of the Andes".
Fig. 12: Four intensive days were spent searching for active nests, which diucas build directly on glacier ice in well-protected, hidden locations (earlier, initial details here).
Fig. 13: Locating active nests of any bird species requires patience and astute observation skills. Extra motivation is required to do so in the snow at elevations above 5000 meters.
Fig. 14: Two key members of the nest-searching team. All bird observations throughout the entire expedition are available in eBird (~50 spp. from >4800 m).
Fig. 15: An adult Diuca speculifera seeking insects on floating ice fragments (see lake in figs 7 & 11).
Fig. 16: At the site of one diuca nest, high on a 60-meter cliff face. Ideally - as in this case - the birds choose nest sites which are safe from predation (esp. Fox, Pseudalopex culpaeus and Mountain Caracara, Phalcoboenus megalopterus) and offer thermal protection (esp. heat loss by longwave radiation). The actual nest site here is ~2 m to the right of the person.
Fig. 17: A juvenile diuca begging for food from a parent.
Fig. 18: Tremendous biodiversity exists in Cordillera Vilcanota. Here a lizard basks in the sun adjacent to glacier ice (background), an atypical environment for most lizard species.
Fig. 19: Quelccaya margin just south of the section we concentrated on this time. A decade ago this margin was also a steep cliff, with numerous diuca nests every year. However, over the past 30 years our measurements with Dave Chadwell (Scripps & UCSD) document that the glacier in this area has thinned by more than 60 meters (paper in review). Where will diucas nest in the future, as recession of the ice cap accelerates and suitable locations disappear?
Fig. 20: Sunrise on Nevado Ausangate, highest peak of the Cordillera Vilcanota (6384 m).
Fig. 1 (above): Quelccaya Ice Cap's western margin, at which our group spent 2+ weeks during April and early May. Note that the transient snowline is already at nearly 5500 m, due to low accumulation and warmth during the strong 2015-16 El Niño. Qori Kalis outlet glacier is partially visible towards the left side of the image; our efforts on this trip were concentrated at the outlet glacier just right of center.
Fig. 2: Alipampa Camp at the end of the road (4765 m), where we spent 2 nights acclimatizing. Snowfall overnight was somewhat unexpected.
Fig. 3: More snow, three mornings later, at Moraine Camp (~5200 m). Note frozen lake, as well as people and horse for scale.
Fig. 4: Quelccaya margin just south of the figure 1 panorama. Tiny patches of new snow are visible on the otherwise-dark ablation zone of the lower ice tongue. This low-albedo surface absorbs roughly half of the solar radiation incident upon it on sunny days, becoming a maze of tiny meltwater runoff channels.
Fig. 5: Qori Kalis outlet glacier, which has thinned dramatically in recent years - yet still extends into the lake.
Fig. 6: Mountain Guide Benjamin Felix Vicencio gets an overview of Qori Kalis.
Fig. 7: After several snowy days initially, high pressure built in over Quelccaya, resulting in extensive melting at all elevations on the glacier. Meltwater production led to hours of repeated calving at this ice face, filling part of the lake with ice fragments.
Fig. 8: Meltwater runoff from the ice margin (above rocks in this view) brought greater discharge to many streams than we had seen previously.
Fig. 9: Evidence from one of the runoff channels of high discharge during the wet season; these are roots from a plant which had become established near the stream.
Fig. 10: At the summit AWS, Felix is always eager to help. For the past 12 years, the station's enclosures have been buried upon our dry-season arrival. During the current El Niño event, accumulation was much lower than normal. Indeed, at the end of April - with potentially 6-7 months of ablation ahead before the next wet season - accumulation (w.e.) was less than any other year of the 2003 ice core record since at least the late-19th century*! We will soon provide more details of this extreme situation.
[*Caveats to this statement are required. Current accumulation is based on the amount present on 2 May 2016, above the 2015 dry season surface (water equivalence). This may under-estimate accumulation if a greater-than-normal proportion of precipitation was in the form of rain and percolated completely through the annual increment. Under-estimation could also occur if a greater proportion of meltwater percolated completely through, rather than refreezing within 2015-16 accumulation. However, the accumulation present in early May has always been less than that preserved when the subsequent wet season begins (due, for example, to dry-season sublimation).]
Fig. 11: The outlet glacier just above our camp, where a major focus of the most-recent expedition was to study the breeding of Diuca speculifera or White-winged Diuca-Finch - the "Glacier Bird of the Andes".
Fig. 12: Four intensive days were spent searching for active nests, which diucas build directly on glacier ice in well-protected, hidden locations (earlier, initial details here).
Fig. 13: Locating active nests of any bird species requires patience and astute observation skills. Extra motivation is required to do so in the snow at elevations above 5000 meters.
Fig. 14: Two key members of the nest-searching team. All bird observations throughout the entire expedition are available in eBird (~50 spp. from >4800 m).
Fig. 15: An adult Diuca speculifera seeking insects on floating ice fragments (see lake in figs 7 & 11).
Fig. 16: At the site of one diuca nest, high on a 60-meter cliff face. Ideally - as in this case - the birds choose nest sites which are safe from predation (esp. Fox, Pseudalopex culpaeus and Mountain Caracara, Phalcoboenus megalopterus) and offer thermal protection (esp. heat loss by longwave radiation). The actual nest site here is ~2 m to the right of the person.
Fig. 17: A juvenile diuca begging for food from a parent.
Fig. 18: Tremendous biodiversity exists in Cordillera Vilcanota. Here a lizard basks in the sun adjacent to glacier ice (background), an atypical environment for most lizard species.
Fig. 19: Quelccaya margin just south of the section we concentrated on this time. A decade ago this margin was also a steep cliff, with numerous diuca nests every year. However, over the past 30 years our measurements with Dave Chadwell (Scripps & UCSD) document that the glacier in this area has thinned by more than 60 meters (paper in review). Where will diucas nest in the future, as recession of the ice cap accelerates and suitable locations disappear?
Fig. 20: Sunrise on Nevado Ausangate, highest peak of the Cordillera Vilcanota (6384 m).
Sunday, April 10, 2016
Ready to check in on El Niño
Snow and sampling tools are packed and ready to help assess 2015-16 El Niño event impact to date at Quelccaya. We will be at the glacier until early May, playing in the snow and recovering frozen samples, Also planned are retrieval of AWS measurements, servicing the station, and doing a geodetic mass balance survey. Some exciting ecology research is part of the program; stay tuned for further details!
Subscribe to:
Posts (Atom)